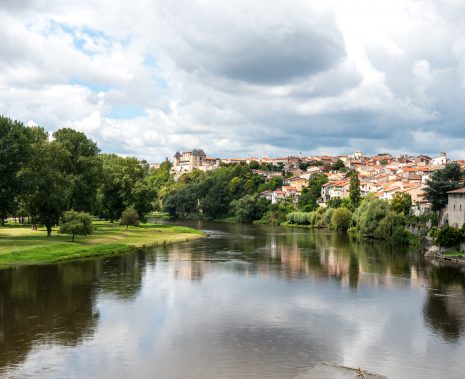
A territory between lake and mountain
Located in the French Alps, in the Savoie region, Lake Bourget drains a catchment area of nearly 600km², mainly fed by the rivers of Leysse, Tillet and Sierroz. This lake has many tourist facilities and serves cities such as Aix-les-Bains, the Motte Servolex or Chambéry.
Ensuring the coordination of territorial approaches to water and aquatic environments management, the Intersyndical Committee for the Sanitation of Lake Bourget (CISALB) is one of the main actors in the territory. Bearing the competence Management of Aquatic Environments and Flood Prevention (GEMAPI), the CISALB carries out a permanent hydrometric monitoring on several issues point of its territory.
In order to ensure this follow-up, CISALB selected TENEVIA to carry out gauging campaigns. The main objective of this mission is to establish rating curves to improve the hydraulic knowledge of the sections instrumented by the administration. Indeed, the CISALB has equipped six measuring sections on its waterways.
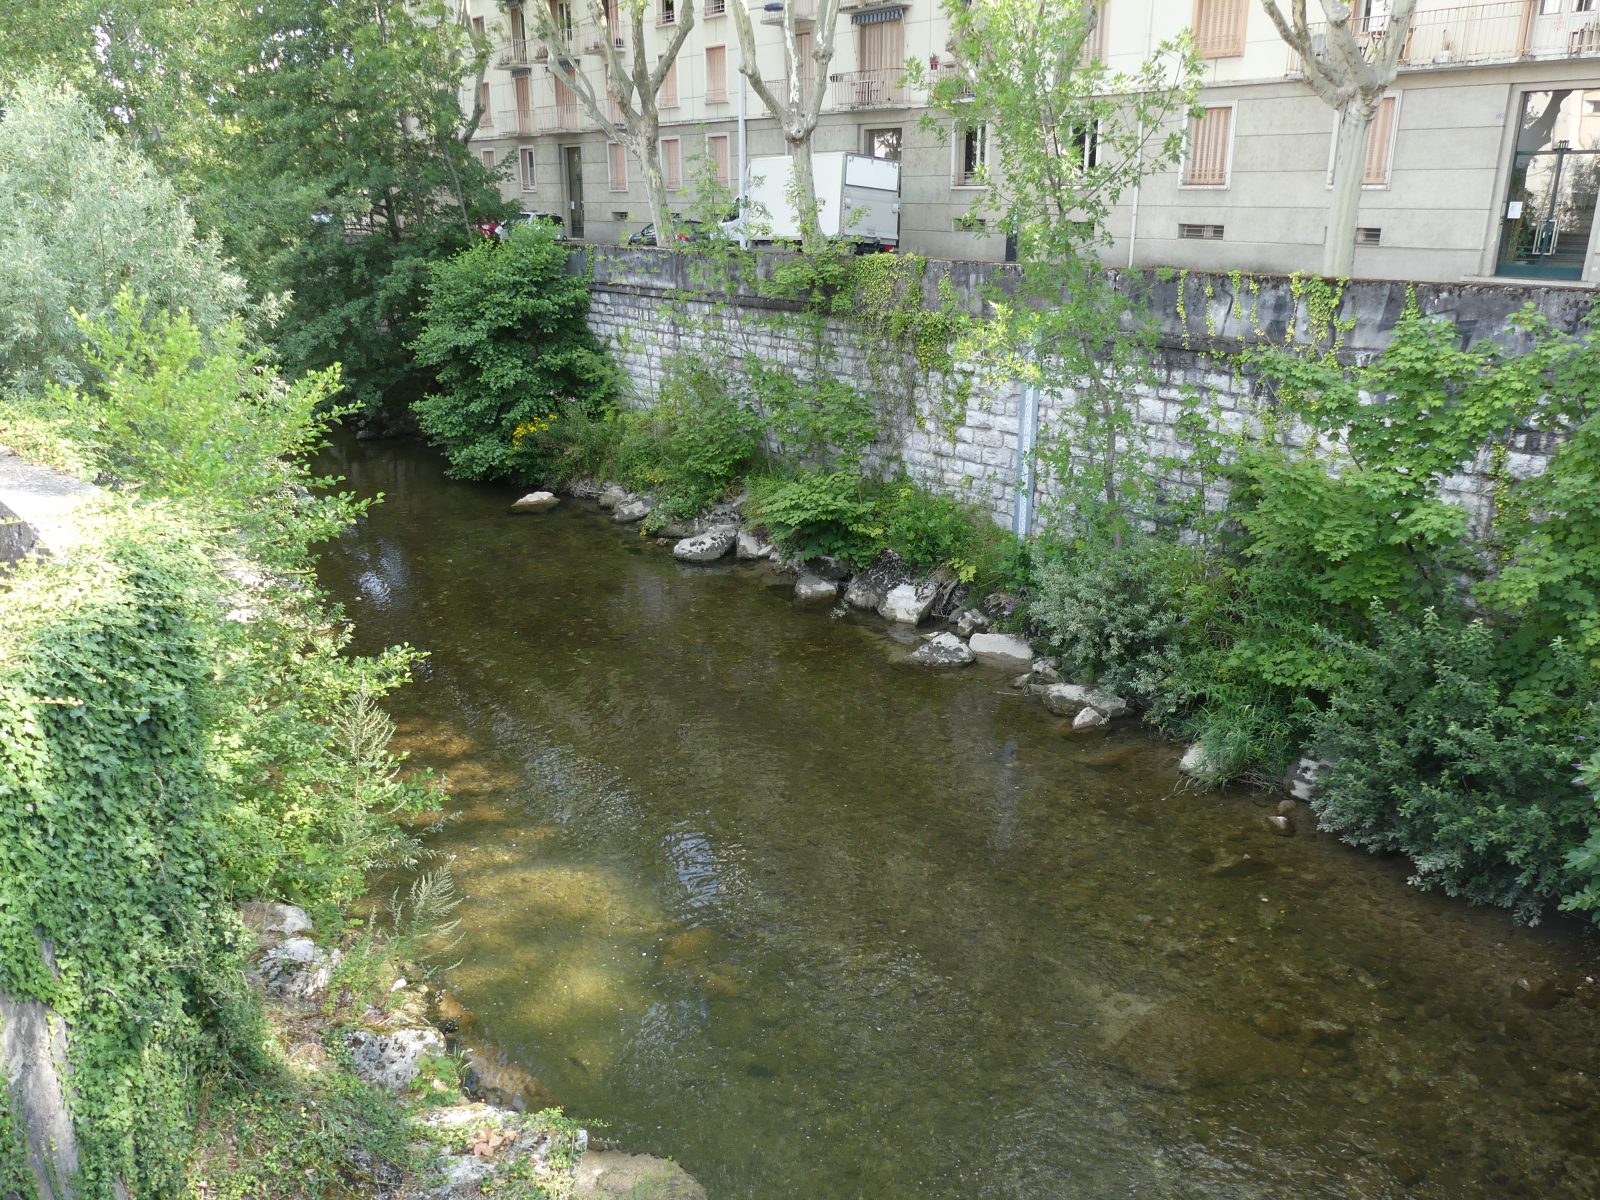
- The Leysse in Chambéry (Width of the section : 20m)
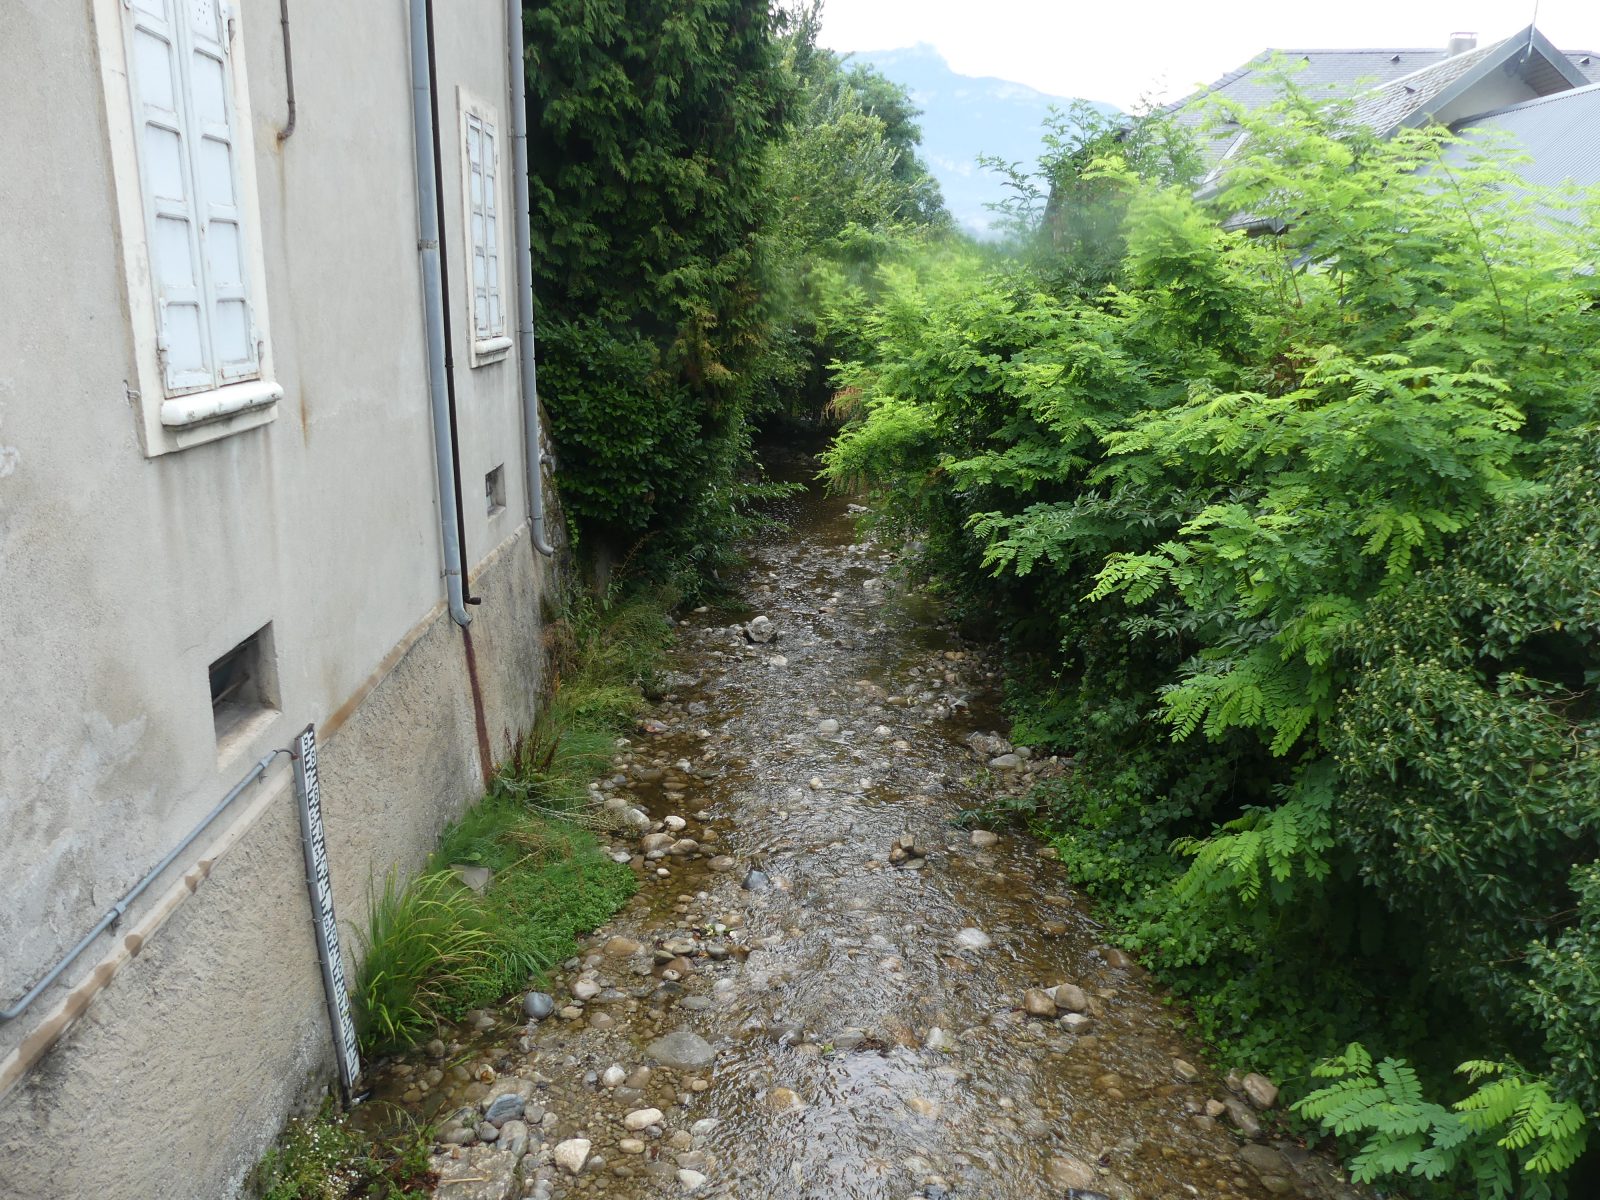
- The Mère in La Ravoire (Width of the section : 10m)
- The Nant-Petchi in Saint-Alban-Leysse (Width of the section : 5m)
- The Nant-Bruyant in la Mottes-Servolex (Width of the section : 10m)
- The Tillet in Méry (Width of the section : 5m)
- The Deysse in Grésy-sur-Aix (Width of the section : 5m)
The information provided by the different sensors is thus used to adapt the strategies for the protection of the aquatic environment and flood prevention implemented by the local authorities.
Carrying out flow measurement campaigns
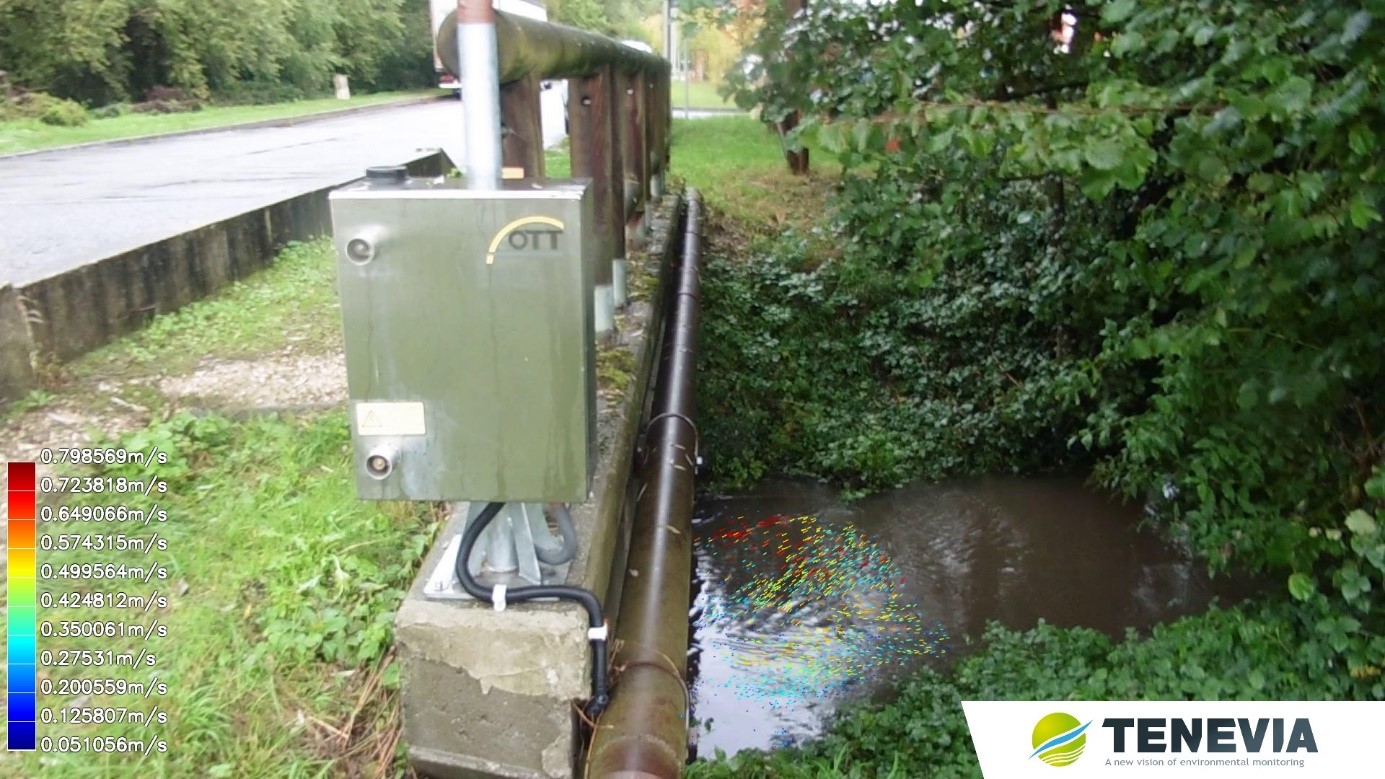
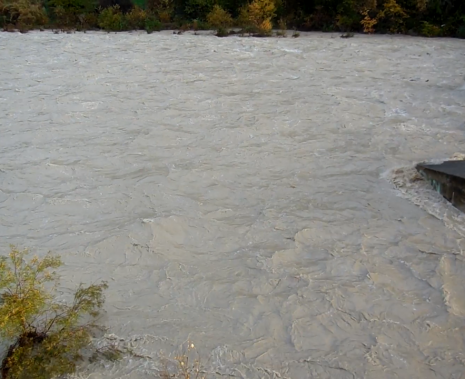
In order to carry out this mission, TENEVIA proposed to the local authority an intervention protocol adaptable to the different conditions of flow. Indeed, in order to obtain the lowest possible rating curves, CISALB has programmed three types of gauging campaign: in low-water, medium-water and high-water. As for the low waters, TENEVIA intervened with conventional measuring tools: an electro-magnetic water flow meter (OTT Hydromet) and an ADCP (Sontek).
On the other hand, for medium and high waters, TENEVIA has deployed its video gauging solution based on the TENEVIA FlowSnap image processing software. Avoiding endangering the operator during high-water conditions, this innovative protocol also makes it possible to move quickly from a site to another in order to cover the most of a rainy episode.
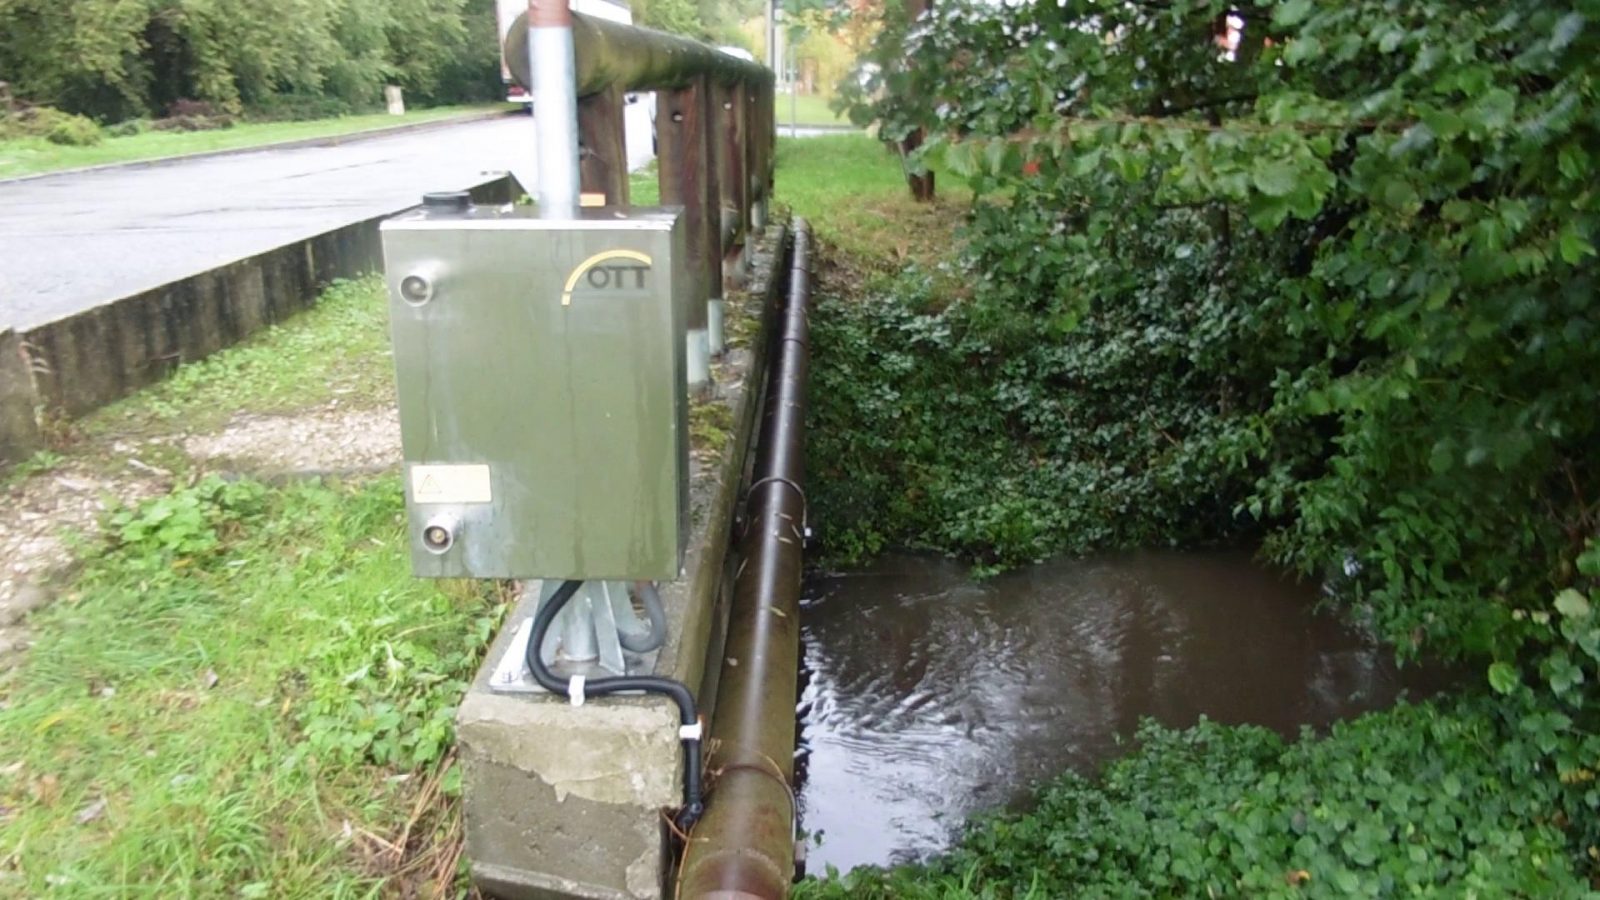
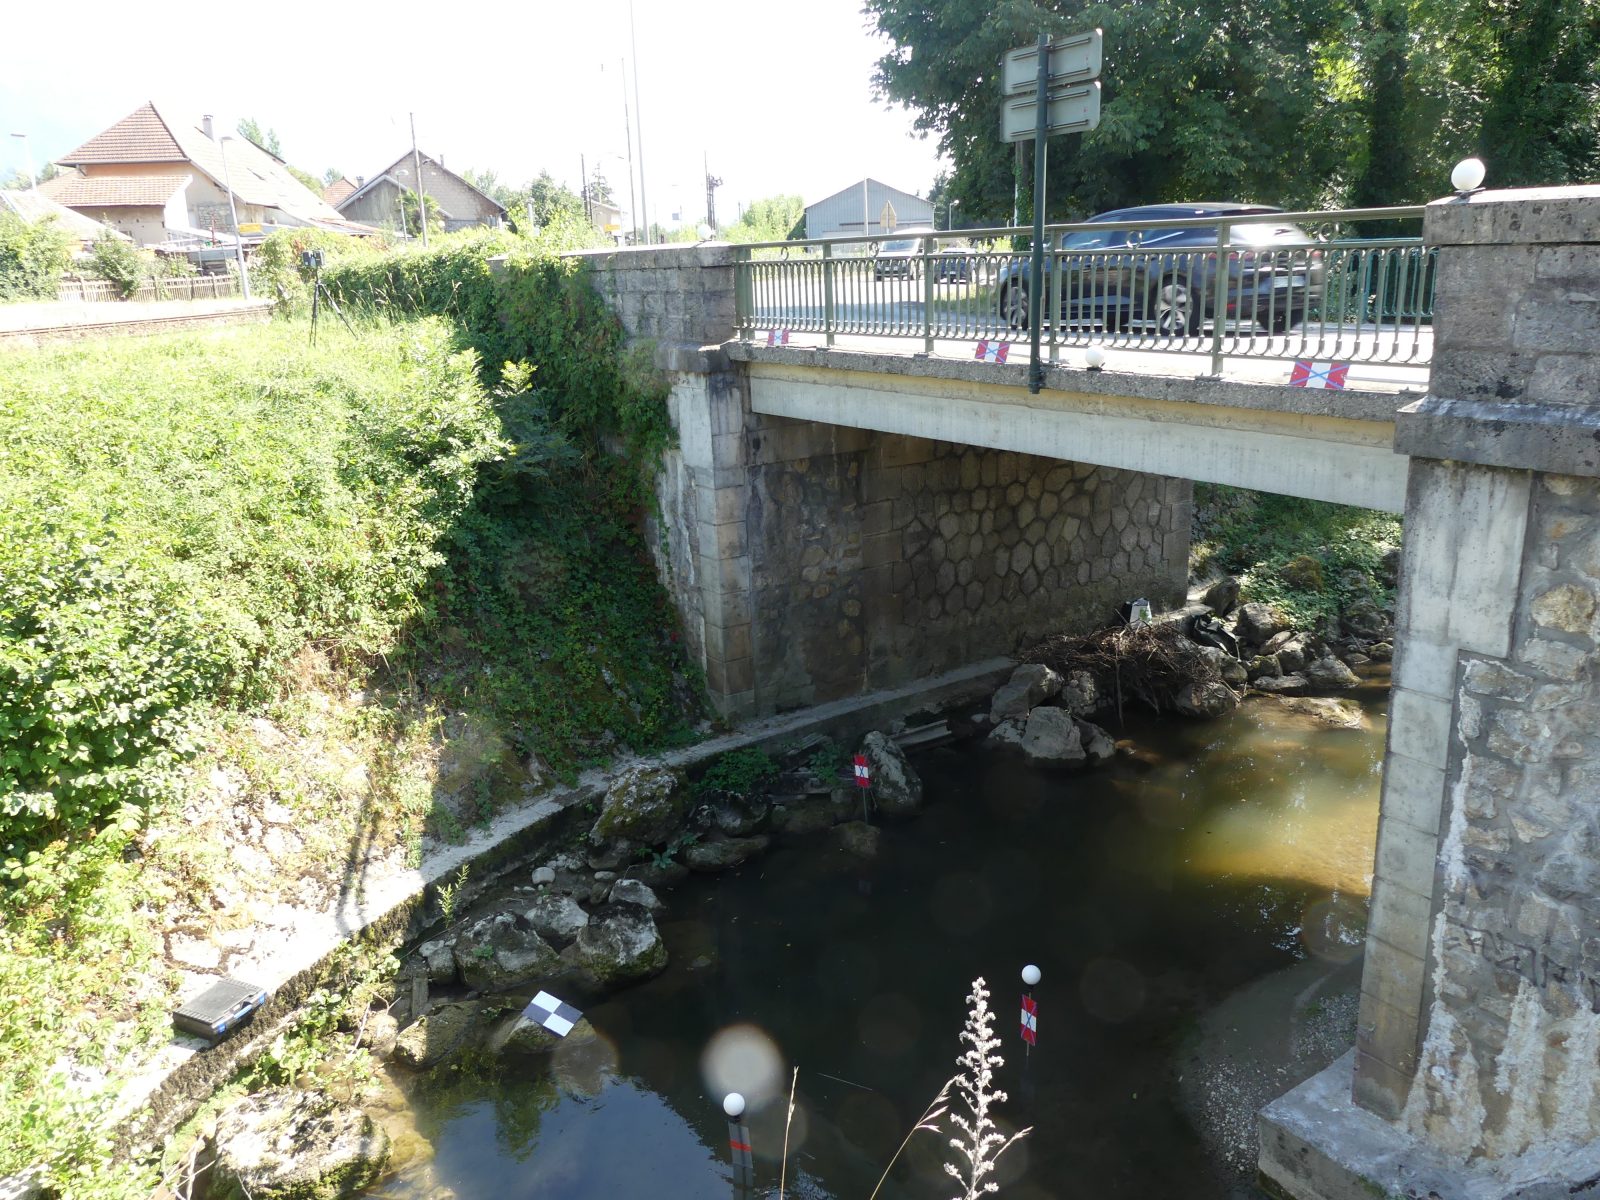
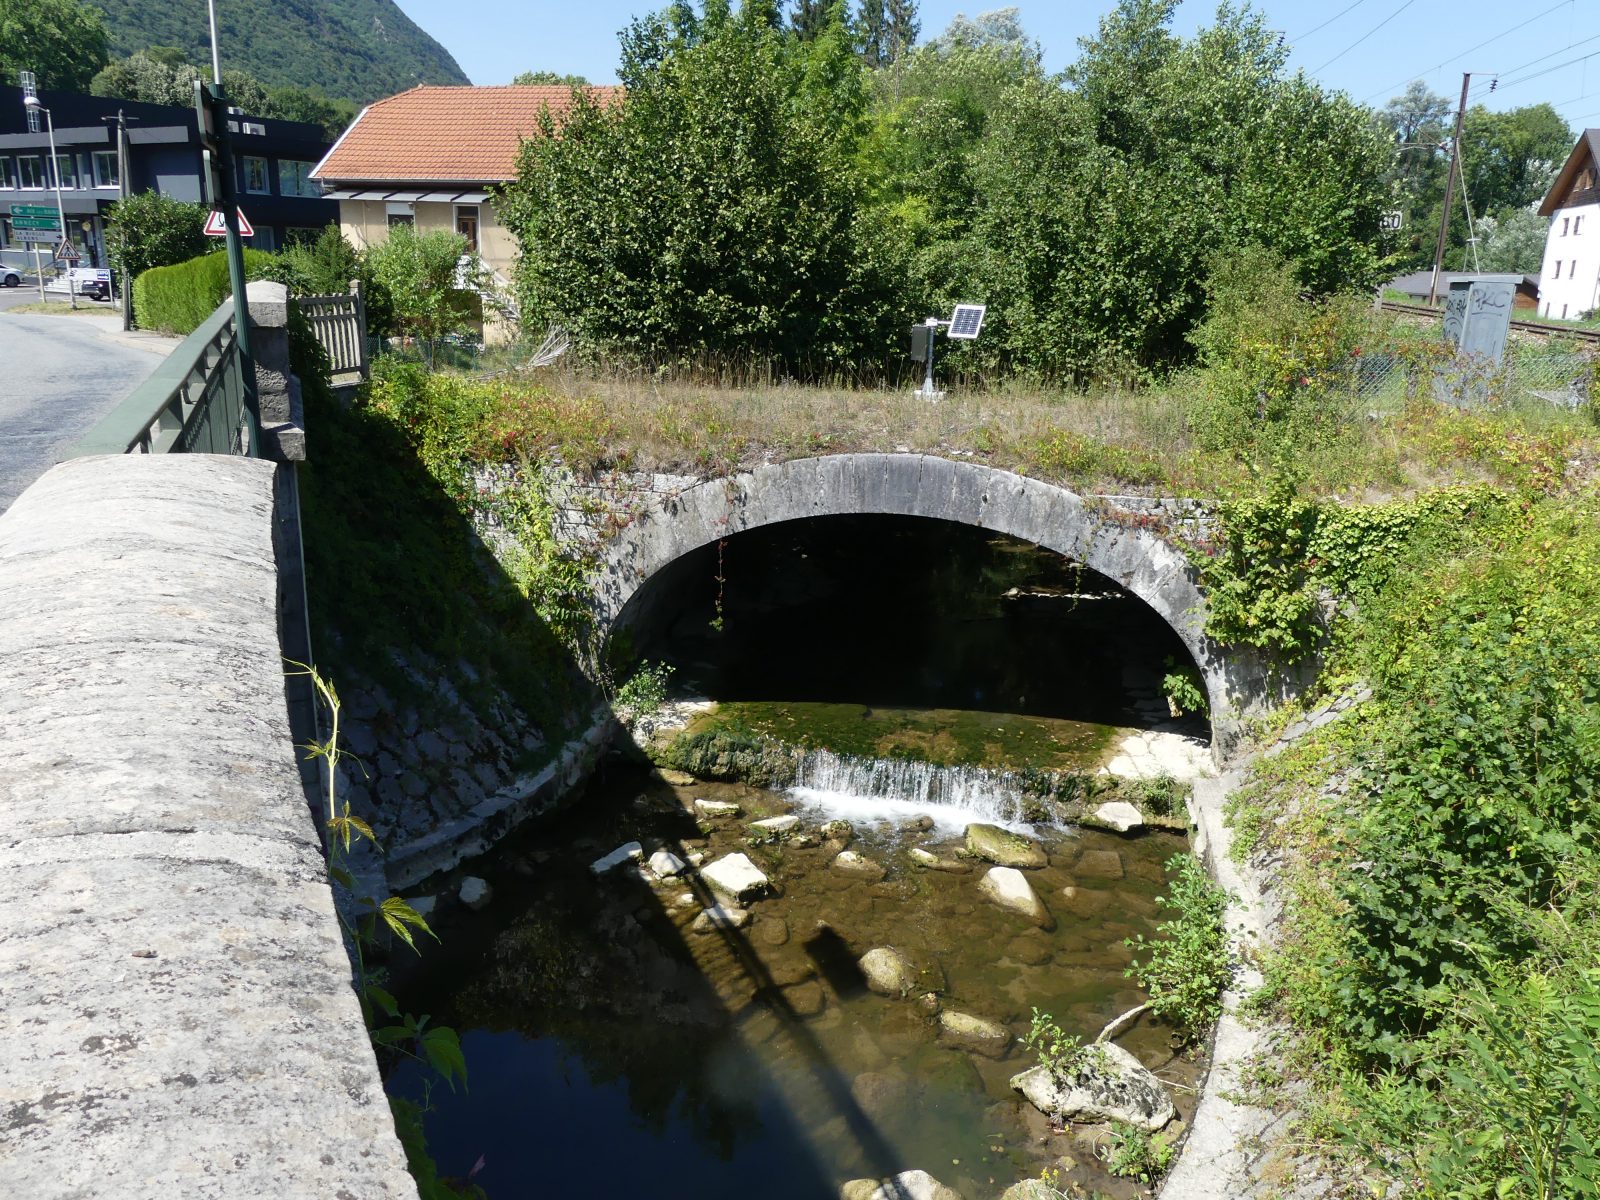
Water level monitoring stations
The different steps of video gauging
Calibration step
The calibration of a site for hydrometry by image processing results in:
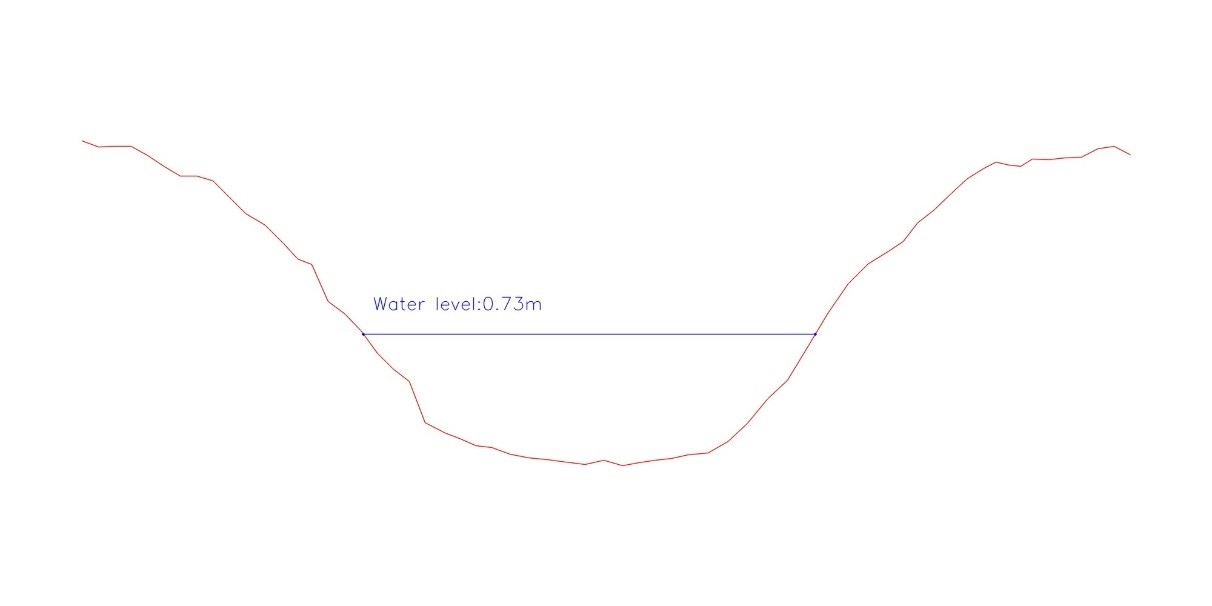
- A 3D topographical survey of the site;
- Current bathymetric profile or ADCP;
- The correlation of these data and the calibration of image processing algorithms.
Note that this step also allows to perform the low-water gauging using the ADCP or the current meter (depending on the sections).
Once the calibration step has been completed, you must visit the site during an event of interest and take a burst of pictures with a camera or a smartphone. The images are then processed using the TENEVIA Flowsnap flow measurement software.
Taking of images and measurements step
The measurement of medium and high waters begins with the taking of a video. This step is done directly by a CISALB river technician with a camera and tripod. The technician, after having ensured that the prerequisites provided by TENEVIA in terms of image taking are respected, makes several videos of approximately 30 seconds each.
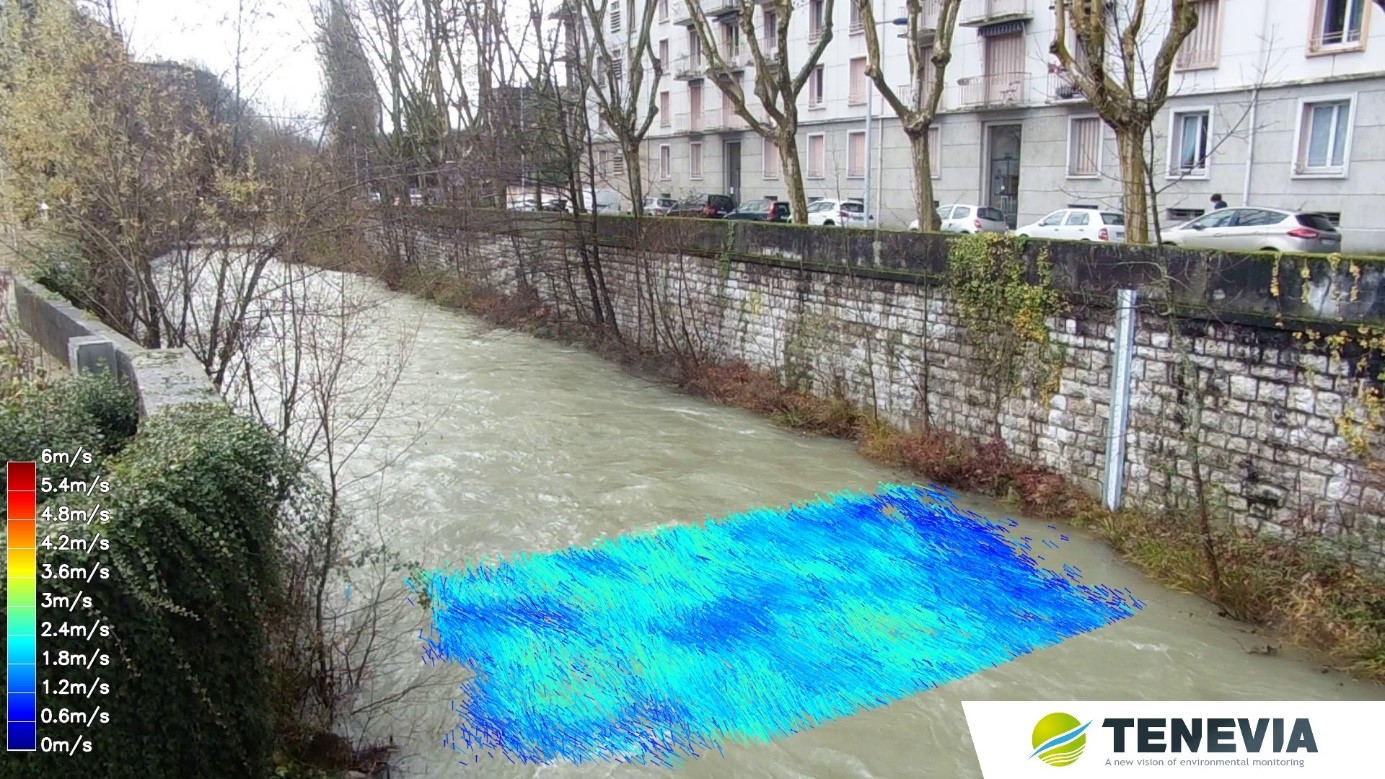
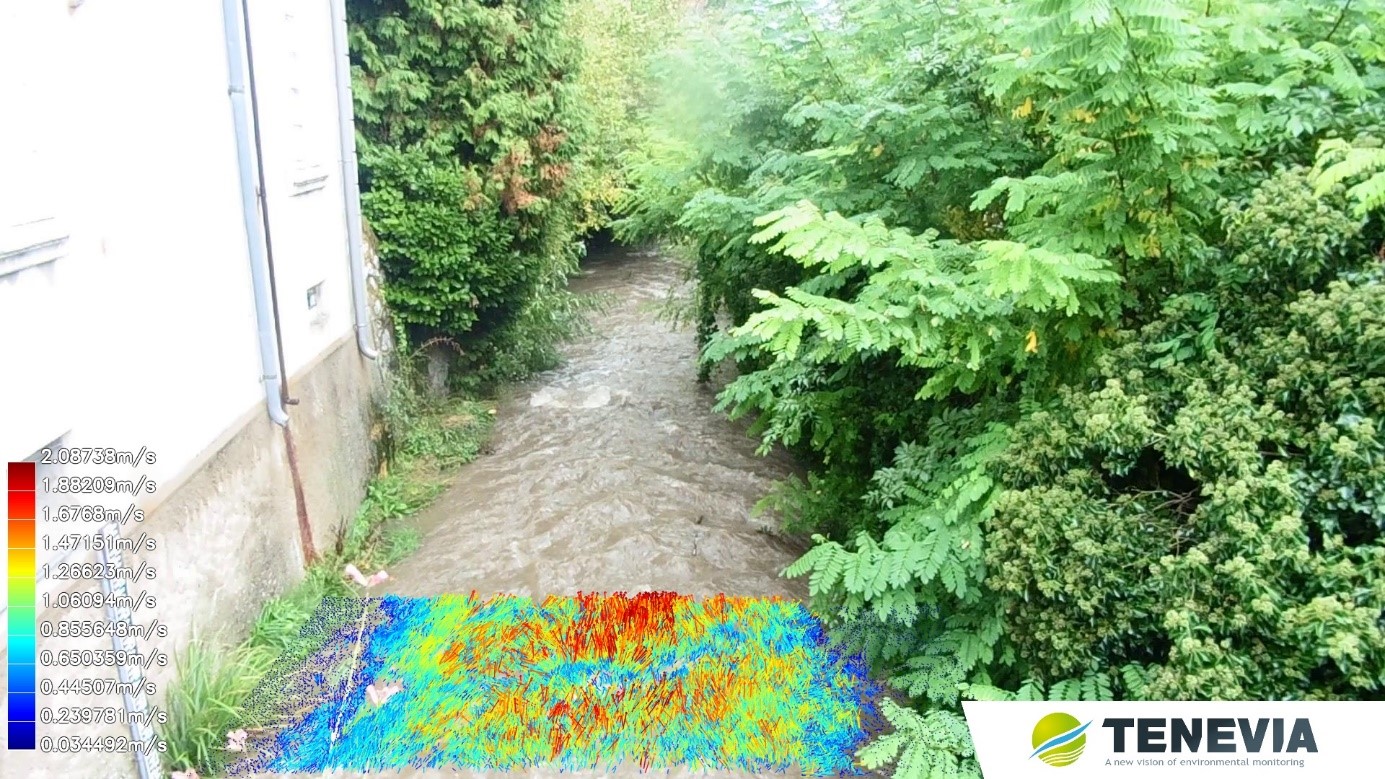
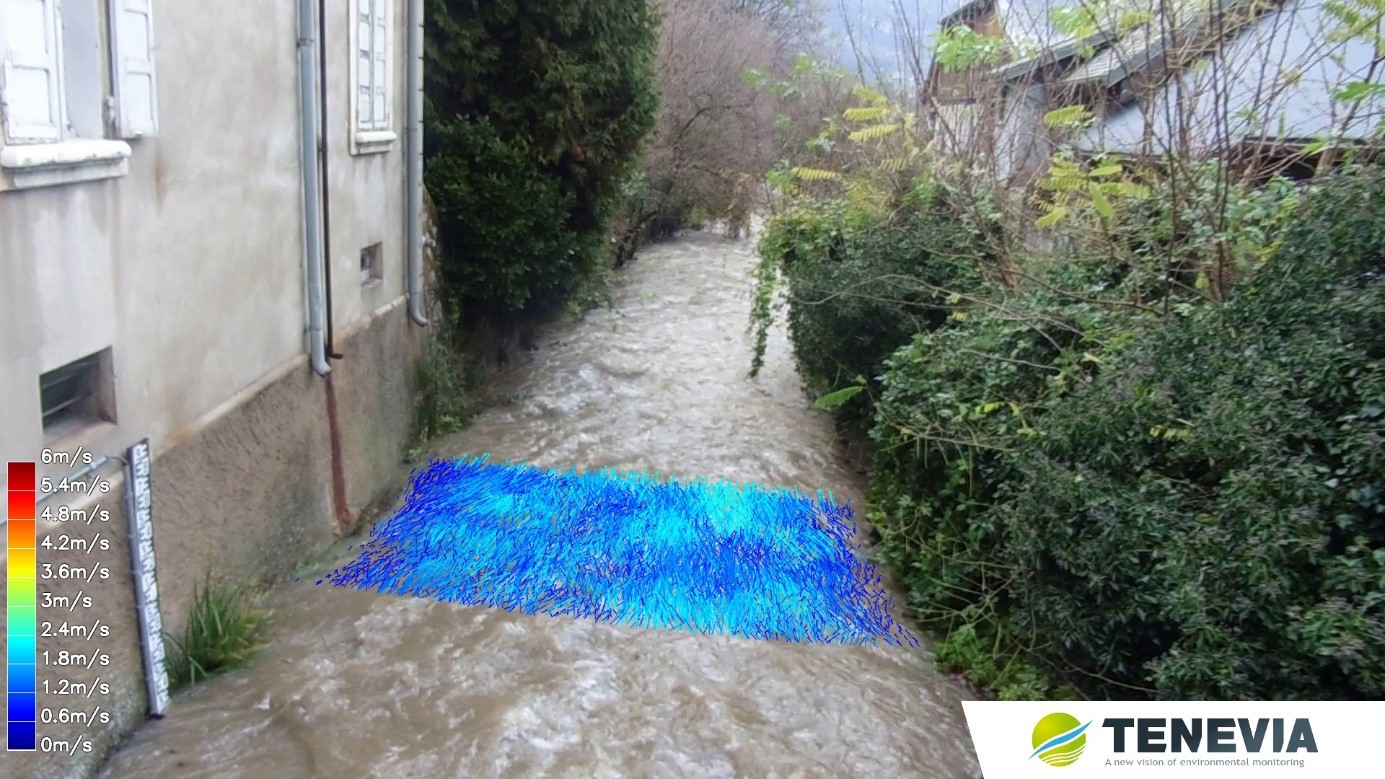
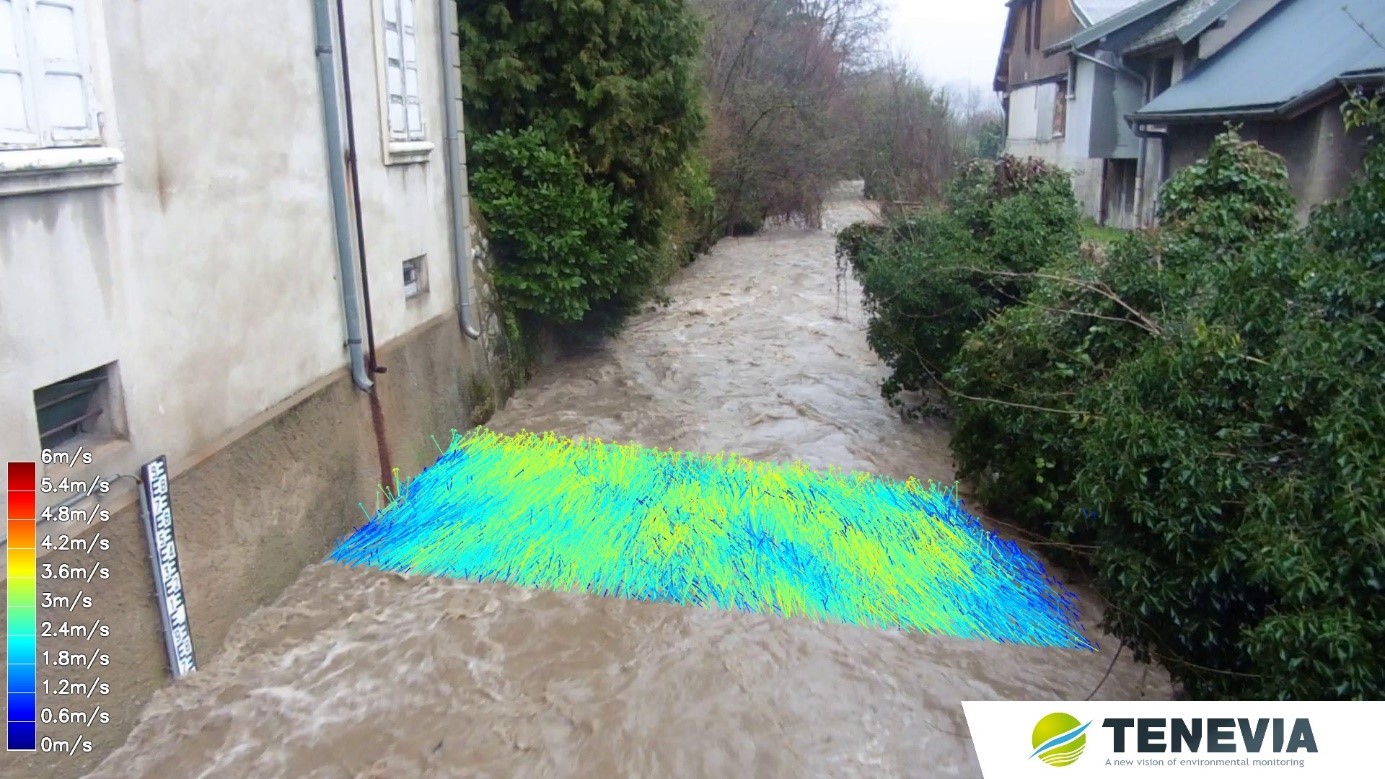
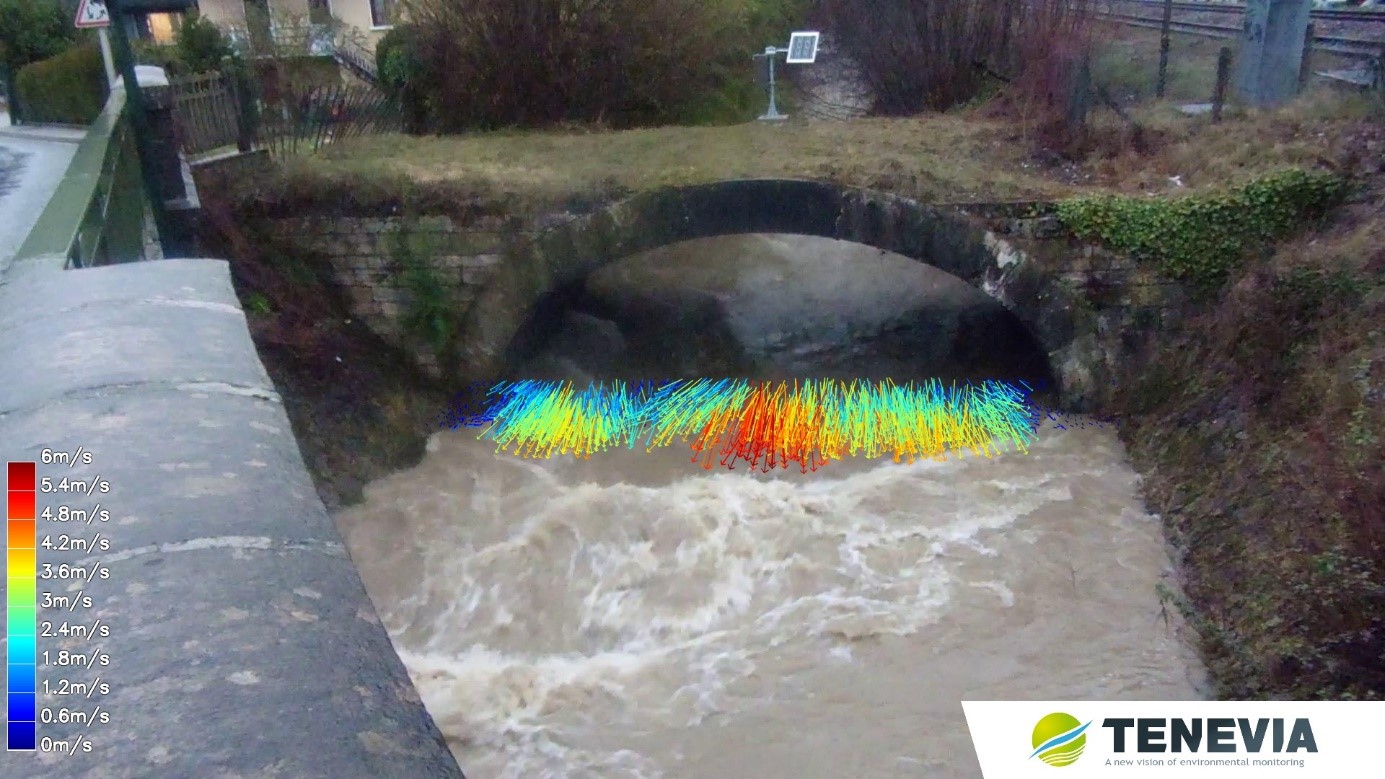
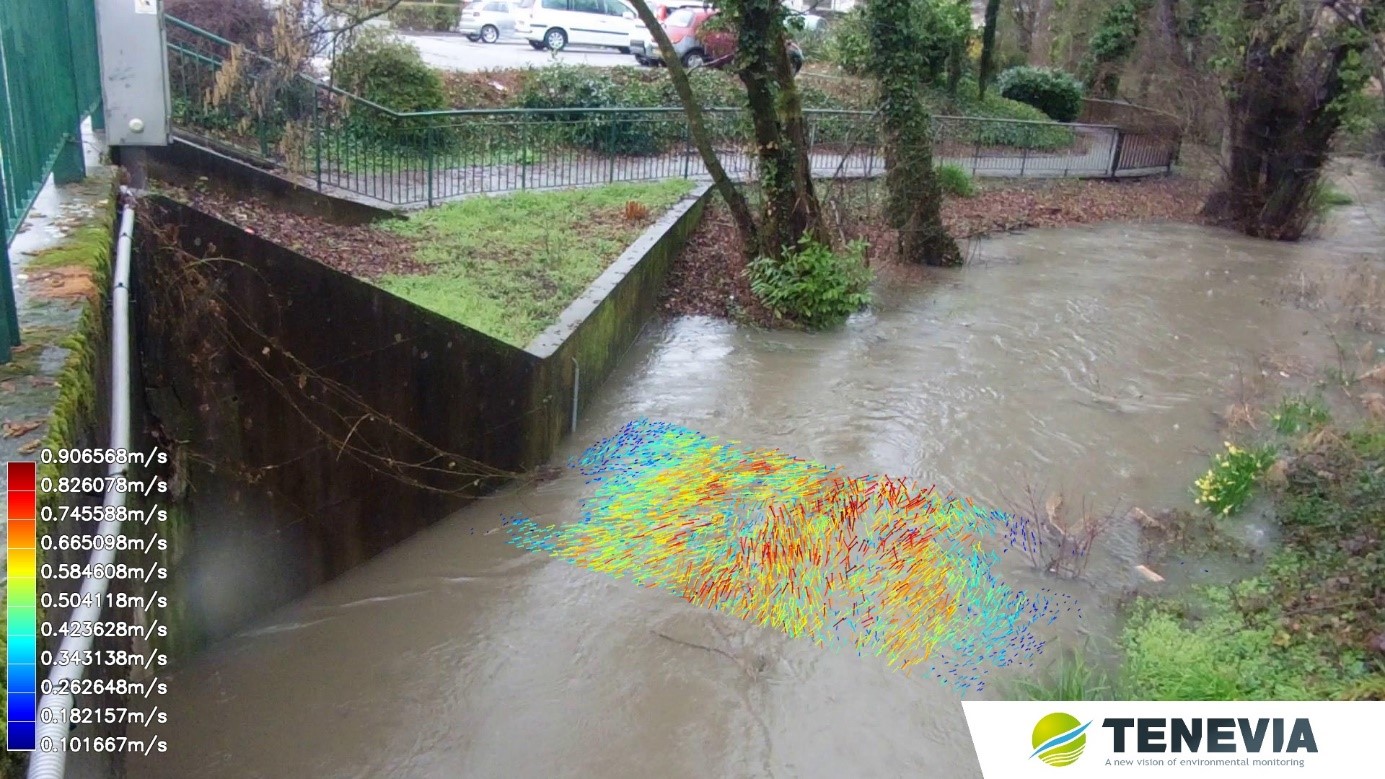
Once completed, these videos are imported into the FlowSnap analysis software. The first step of processing within the software is to obtain surface vectors for velocity measurement. These surface vectors can be of different types but must be perceptible to the eye such as, for example, singularities on the surface of the water (branches, bubbles, leaves, etc.) or movement of waves as well as water structures.
The measurement principle is very easy to understand. It consists in detecting and measuring surface movements between pairs of very close images (example: 2 images in the same second).
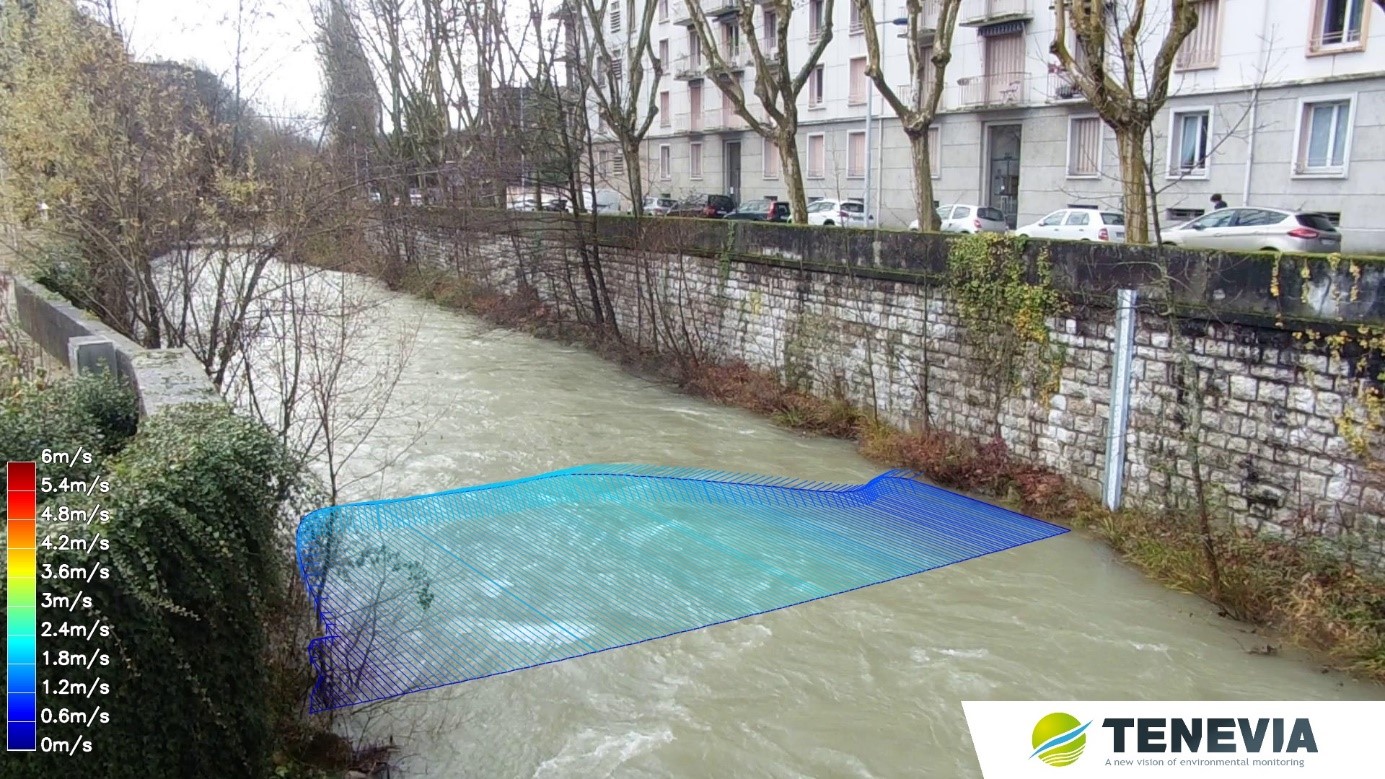
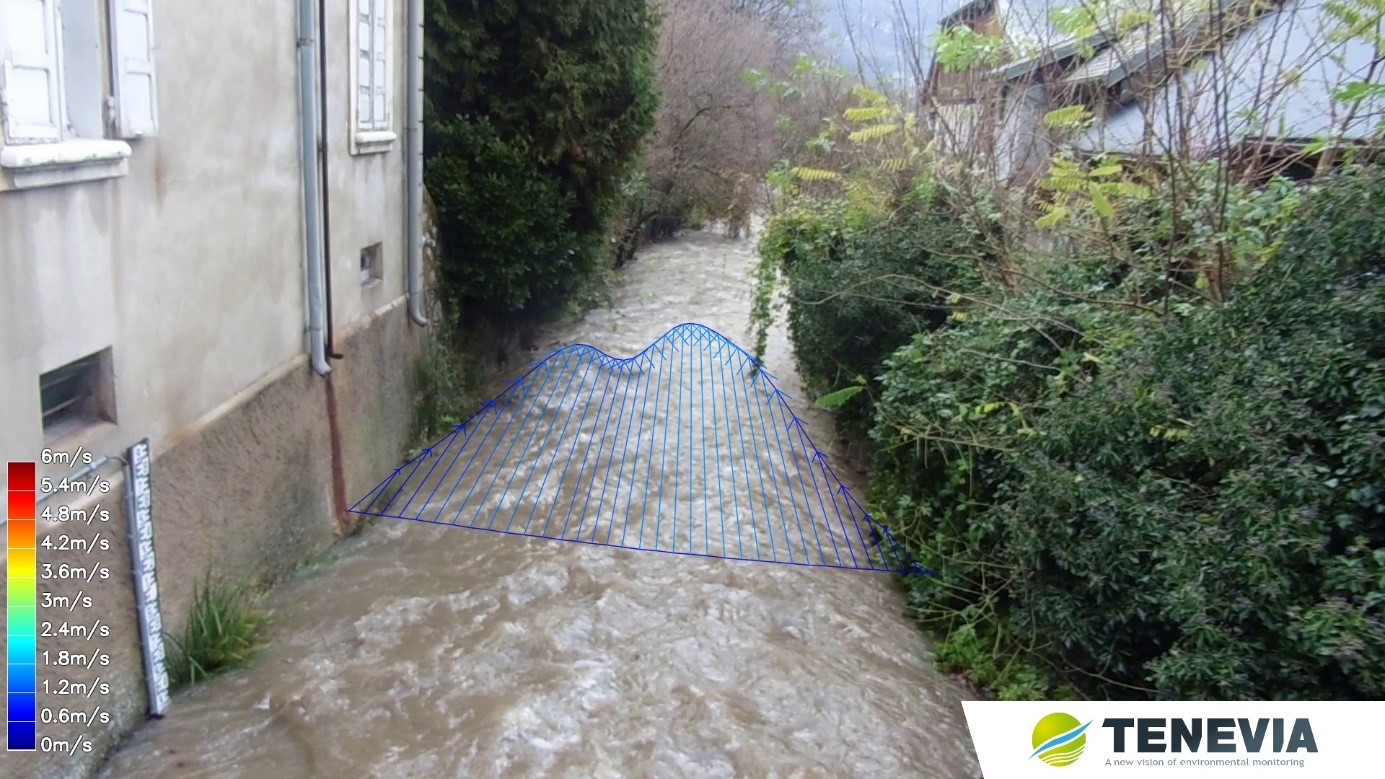
Once the velocity vectors have been acquired, the results are used to calculate a transverse velocity profile over the entire section.
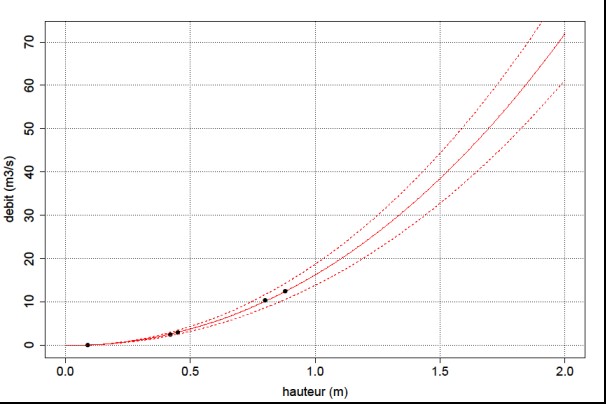
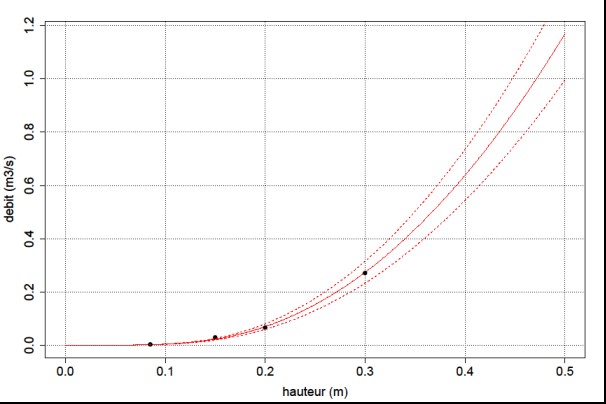
Drawing up the rating curves step
The flow rate calculation is made from the various gauging carried out previously. Regarding the realization of measurements by images processing, the more numerous the surface velocity vectors, the better the discharge estimates are. This is why this system is optimal for medium and high water applications. For the low waters of small rivers or canals, because of low surface velocity, it is advisable to make the rating curve more reliable by using traditional current meter or ADCP gauges.
Video flow measurement and rating curves drawing